Image Details
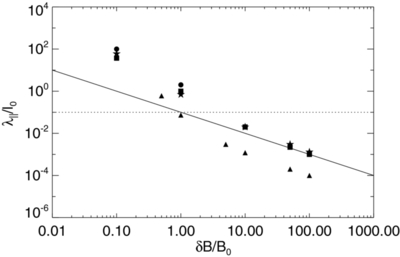
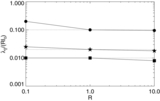
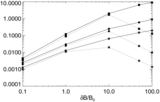
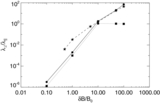
Caption: Figure 3.
λ ∥ normalized to the bendover length l 0 vs. turbulence strength δ B/ B 0 for low energetic particles R = 0.1. The plot also shows λ ∥/ l 0 for the three different models (slab, composite, and isotropic), plotted as circles, squares, and stars, respectively. The dashed lines represent the standard Bohm limit with λ ∥ ~ R L , whereas the solid lines indicate the modified Bohm limit where λ ∥ ~ R LB 0/δ B. Triangles represent the Shalchi (2005) simulations.
Other Images in This Article

Copyright and Terms & Conditions
© 2014. The American Astronomical Society. All rights reserved.
Copyright ©
2025 Astronomy Image Explorer. All Rights Reserved.