Image Details
Caption: Figure 22.
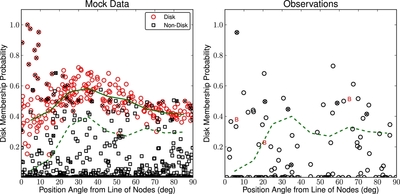
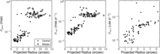
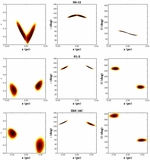
Left: disk membership probability plotted against position angle from the disk line of nodes (Ω = 96
![]() 3) for the 10 simulations with
f
disk = 0.2. True disk members are shown as red circles (
N = 240), while stars from the isotropic population are marked as black squares (
N = 960). Stars with significant acceleration detections are marked with an "x." For disk stars, the probability of disk membership
is a function of the angular offset from the disk's line of nodes. Non-accelerating disk stars with small angular offsets
(<20°) show relatively large scatter in disk membership probability. We compute the median and standard deviation of the probability
in angular offset bins of 10° for all non-accelerating disk stars. The median and 3σ lower-limit values are shown as the green
solid and dashed curves, respectively. Right: same plot, but for the observed sample of
N = 116 stars. The 3σ lower-limit curve is overplotted. Points above this curve represent the most likely members of the clockwise
disk. The 3 B stars that are likely disk members are indicated with the letter "B."
3) for the 10 simulations with
f
disk = 0.2. True disk members are shown as red circles (
N = 240), while stars from the isotropic population are marked as black squares (
N = 960). Stars with significant acceleration detections are marked with an "x." For disk stars, the probability of disk membership
is a function of the angular offset from the disk's line of nodes. Non-accelerating disk stars with small angular offsets
(<20°) show relatively large scatter in disk membership probability. We compute the median and standard deviation of the probability
in angular offset bins of 10° for all non-accelerating disk stars. The median and 3σ lower-limit values are shown as the green
solid and dashed curves, respectively. Right: same plot, but for the observed sample of
N = 116 stars. The 3σ lower-limit curve is overplotted. Points above this curve represent the most likely members of the clockwise
disk. The 3 B stars that are likely disk members are indicated with the letter "B."
Other Images in This Article

Show More
Copyright and Terms & Conditions
© 2014. The American Astronomical Society. All rights reserved.