Image Details
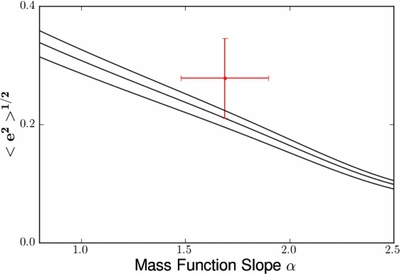
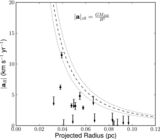
Caption: Figure 20.
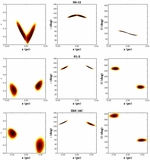
Predicted rms eccentricity (black curves) of 50 stars, each with mass
M = 25
M
☉ , resulting from two-body interactions within a stellar disk with various mass function slopes. This is a version of Figure
4 in Alexander et al. (2007), which has been updated to reflect the latest black hole mass estimates (4 × 10
6
M
☉ ) and a recent estimate of the age of the young star population from Lu et al. (2013) of 3.65 ± 0.87 Myr. From bottom to
top, the three curves represent the rms eccentricity after 2.78 Myr, 3.65 Myr, and 4.52 Myr, respectively. The red point shows
the rms eccentricity and estimated uncertainty of our best measured stars (
![]() e
2
e
2
![]() 1/2 = 0.28 ± 0.07) and the latest estimate of the mass function slope (α = 1.7 ± 0.2) from Lu et al. (2013). The observed values
are within 1σ of the predicted values from the Alexander et al. model.
1/2 = 0.28 ± 0.07) and the latest estimate of the mass function slope (α = 1.7 ± 0.2) from Lu et al. (2013). The observed values
are within 1σ of the predicted values from the Alexander et al. model.
Other Images in This Article

Show More
Copyright and Terms & Conditions
© 2014. The American Astronomical Society. All rights reserved.