Image Details
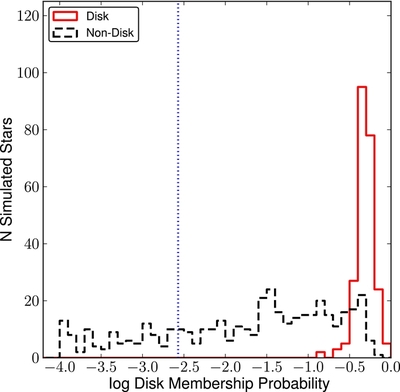
Caption: Figure 18.
Combined histogram of disk membership probabilities (1 − L non -disk) for the 10 simulations with f disk = 0.2. True disk members are shown as the red solid histogram, while the isotropic population is shown as the black dashed histogram. The vertical blue dotted line marks the criteria used for selecting candidate disk members, namely (1 − L non -disk) > 0.0027. While this conservative threshold identifies all true disk members as candidates, there is an abundance of contaminants, even at the highest probabilities. An additional 544 isotropic stars were cut off to the left of the figure for clarity.
Other Images in This Article

Show More
Copyright and Terms & Conditions
© 2014. The American Astronomical Society. All rights reserved.