Image Details
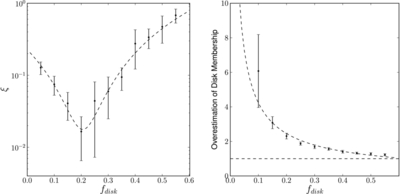
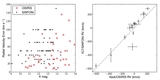
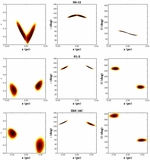
Caption: Figure 17.
Left: sum of the squared differences in density between the disk fraction models and the observations (see Section 4.2.4), averaged over the ten independent trials run for each disk fraction model. A second-order polynomial was fit to the data (dashed curve) and gives a minimum ξ value at f disk = 0.21, implying a true disk fraction in our sample of 21%, or ~24 stars. Right: the level to which the true number of disk members is overestimated in each disk-fraction model, again averaged over the 10 trials run for each disk fraction model. As a visual reference, a dashed line marks where the number of candidate disk stars equals the true number in each simulation. Note that the Y-axis is truncated for clarity. For f disk = 0.21, the number of disk candidates is overestimated by a factor of 2.4.
Other Images in This Article

Show More
Copyright and Terms & Conditions
© 2014. The American Astronomical Society. All rights reserved.