Image Details
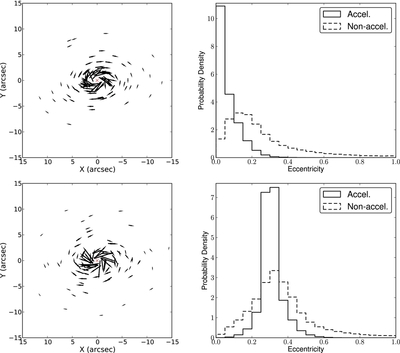
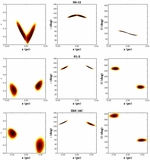
Caption: Figure 15.
Simulated circular (top) and eccentric ( e = 0.3; bottom) orbits each consisting of 100 stars within a disk with an orbital plane orientation similar to that of the observed disk. For each simulation, the generated velocity vectors of the stars are shown on the left, with the location of the black hole being marked as a red X at the center. The eccentricity distributions of the accelerating (solid) and non-accelerating (dashed) stars from each simulation are shown on the right. The orbits of the accelerating stars are more accurately determined, as expected. Based on these simulations, the observed eccentricity distribution in Figure 12 cannot be a result of measurement bias added to an intrinsically circular disk.
Other Images in This Article

Show More
Copyright and Terms & Conditions
© 2014. The American Astronomical Society. All rights reserved.