Image Details
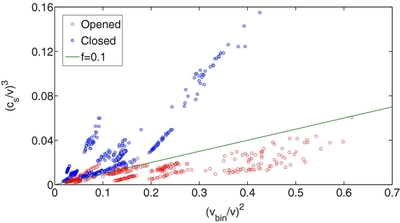
Caption: Figure 1.
Cubic ratio between the sound speed of the gas and the rotational velocity of the binary–disk system, ( c s/ v) 3, plotted against the quadratic ratio between the rotational velocity of the isolated binary and the rotational velocity of the binary–disk system, ( v bin/ v) 2. The red circles indicate simulations where the binary has opened a gap in the disk (opened simulations), and the blue circles are simulations where the disk does not have a gap (closed simulations). We plot together all the simulations with different values of the mass ratio q that we explore. The straight line is the linear q-independent threshold between the opened simulations and the closed simulations predicted by our analytic gap-opening criterion. Below the line are the opened simulations and above are the closed simulations. The slope of the interface is the function f.
Other Images in This Article
Copyright and Terms & Conditions
© 2014. The American Astronomical Society. All rights reserved.