Image Details
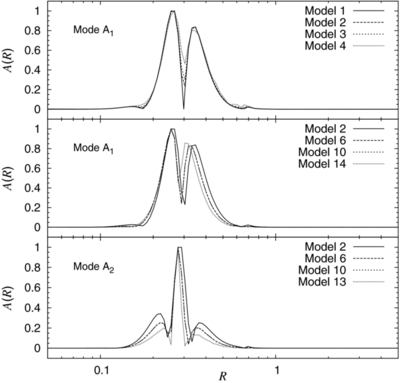
Caption: Figure 4.
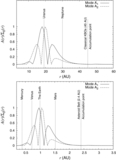
Variation of the amplitude profile A( R) of modes A 1 and A 2 in models with different mass parameters and drag coefficients. See Table 2 for the specifications of the models. The difference between models 6 and 10 is indistinguishable in the plots. The R-axis is in logarithmic scale.
Other Images in This Article
Copyright and Terms & Conditions
© 2013. The American Astronomical Society. All rights reserved.
Copyright ©
2025 Astronomy Image Explorer. All Rights Reserved.