Image Details
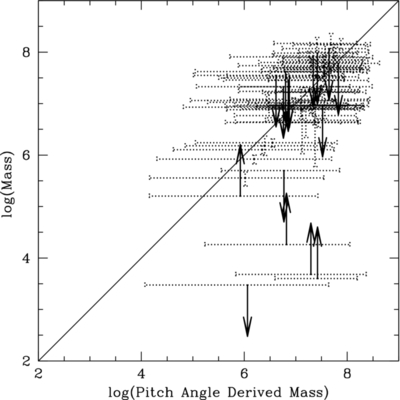
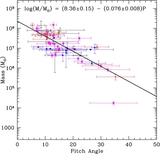
Caption: Figure 5.
Measured black hole mass of our sample of galaxies compared to the mass derived by applying the fit illustrated in Figure 1 to our measured pitch angles for the same objects. The solid black line is included to illustrate the 1:1 relation, and the distance of each point from the line gives the residual. It will be noticed that some of the limits contradict our fit, as discussed in the text. Two in particular, M33 and IC 342, do so strikingly.
Other Images in This Article
Copyright and Terms & Conditions
© 2013. The American Astronomical Society. All rights reserved.
Copyright ©
2026 Astronomy Image Explorer. All Rights Reserved.