Image Details
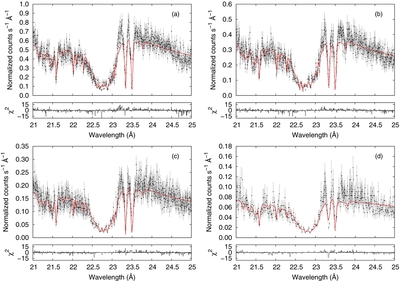
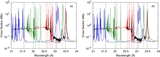
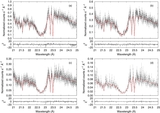
Caption: Figure 3.
Spectral fit of the Chandra MEG observations of XTE J1817-330 in the oxygen absorption region (21–25 Å) using a simple functional model (power law and several Gaussian profiles). (a) ObsID 6615. (b) ObsID 6616. (c) ObsID 6617. (d) ObsID 6618. The observed absorption features are interpreted as the neutral O K-edge (≈23.1 Å); the Kα, Kβ, and Kγ lines of O i (≈23.50 Å, ≈22.88 Å, and ≈22.68 Å, respectively); the Kα, Kβ, and Kγ lines of O ii (≈23.35 Å, ≈22.28 Å, and ≈22.10 Å, respectively); and the Kα lines of O iii, O vi, and O vii (≈23.10 Å, ≈22.02 Å, and ≈21.58 Å, respectively). See Table 4 for more details.
Other Images in This Article
Copyright and Terms & Conditions
© 2013. The American Astronomical Society. All rights reserved.