Image Details
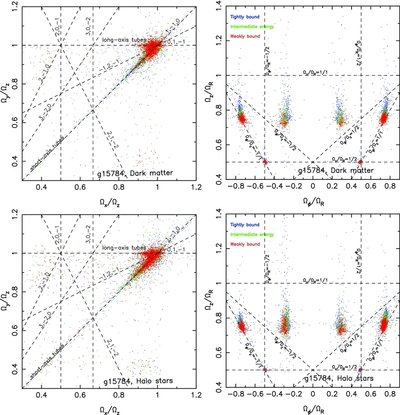
Caption: Figure 6.
Frequency maps for dark matter particles (top row), halo stars (bottom row) selected within 50 kpc of the galactic center. Left: frequencies computed in Cartesian coordinates; right: frequencies computed in cylindrical coordinates. Colors represent binding energies of particles and dashed lines mark major resonances (see text).
Other Images in This Article
Copyright and Terms & Conditions
© 2013. The American Astronomical Society. All rights reserved.
Copyright ©
2025 Astronomy Image Explorer. All Rights Reserved.