Image Details
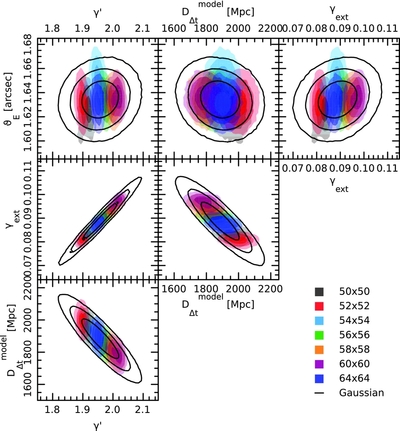
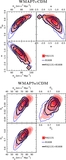
Caption: Figure 3.
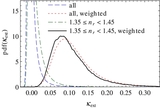
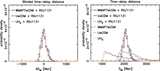
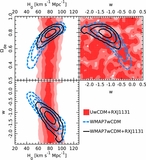
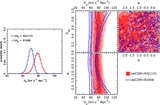
Posterior of the key lens model parameters for the lensing and time-delay data. Each color represents a particular source resolution that is the dominant systematic uncertainty in the modeling of the ACS data. The solid curves are a Gaussian fit to the PDF by weighting each source resolution chain equally. The contours/shades mark the 68.3%, 95.4%, and 99.7% credible regions.
Other Images in This Article

Show More
Copyright and Terms & Conditions
© 2013. The American Astronomical Society. All rights reserved.
Copyright ©
2025 Astronomy Image Explorer. All Rights Reserved.