Image Details
Caption: Figure 2.
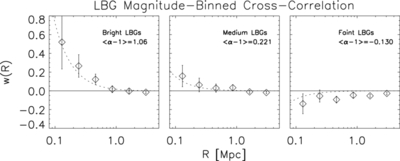
Angular cross-correlation of the X-ray groups with Lyman break galaxies, the latter separated into three magnitude-selected
samples. The bright sample contains
U-,
G-,
B-, and
R-dropouts in the magnitude ranges 23 <
r < 25, 23.5 <
i < 25, 23.5 <
i < 25, and 24 <
z < 25.5, respectively. Similarly, the medium ranges are 25 <
r < 25.5, 25 <
i < 26, 25 <
i < 26, 25.5 <
z < 26. The faint ranges are
r > 25.5,
i > 26,
i > 26,
z > 26. These magnitude ranges are selected to contain LBGs for which (α − 1) > 0, ≈0, and <0. The measured correlations for
each LBG sample are simply averaged here (weighting by the number counts) in order to more clearly display this diagnostic
check. The dashed curves are calculated from the composite-NFW fit, using weighting by the appropriate
![]() α − 1
α − 1
![]() factor, which is given in each panel. The negative correlation observed for the faintest sample is a good indication that
no redshift overlap exists between foreground lenses and background sources.
factor, which is given in each panel. The negative correlation observed for the faintest sample is a good indication that
no redshift overlap exists between foreground lenses and background sources.
Other Images in This Article
Copyright and Terms & Conditions
© 2012. The American Astronomical Society. All rights reserved.