

Image Details
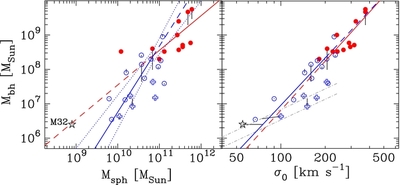
Caption: Figure 1.
Optimal
M
bh–
M
sph and
M
bh–σ
0 relations for a dozen "core" galaxies (red dots) and a dozen non-barred Sérsic galaxies (blue circles). Blue crosses denote
five barred Sérsic galaxies used in Table 1. The dashed lines show the extrapolation of these relations beyond
M
sph = 7 × 10
10
M
☉ The dotted lines in the left panel delineate the one-sigma uncertainty on the
M
bh–
M
sph relation for the Sérsic galaxies. The short lines emanating from the data points show their old location based on the data
in Häring & Rix (2004). The faint dot-dashed gray lines in the right panel correspond to a sphere of influence of 0
 1 at distances of 3 Mpc (lower) and 6 Mpc (upper), respectively.
Copyright and Terms & Conditions
© 2012. The American Astronomical Society. All rights reserved.

