Image Details
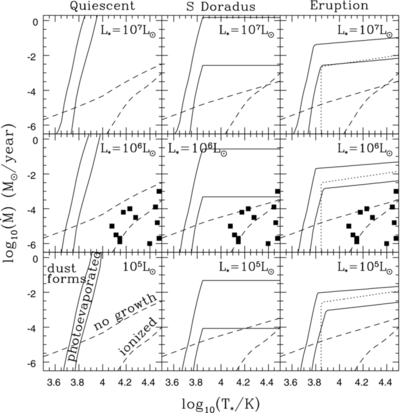
Caption: Figure 1.
Minimum mass-loss rates
 for silicate dust formation as a function of stellar temperature
T
*. The results for graphitic dusts are very similar. The lower left panel labels the regions. Dust can form in the region labeled
"dust forms," above the photoionization ("ionized"), growth ("no growth"), and photoevaporation ("photoevaporated") limits.
The photoevaporation limits are for minimum photon energies of
E
0 = 7.5 (stronger) and 10 eV (weaker). The left, middle, and right columns are for the three different assumptions about the
apparent photospheric temperature. In the quiescent state (left) the photospheric temperature is the stellar temperature,
T
phot =
T
*, in the S Doradus state (middle) the photospheric temperature of
T
phot = min(
T
*, 7000 K) is assumed to be determined by an expansion of the stellar photosphere that is uncorrelated with the wind, and in
the eruptive state (right) the apparent temperature is determined by the non-dust optical depth of the wind. The dotted contour
in this column is the contour where
T
phot = 7000 K. The upper, middle, and lower panels show the changes for stellar luminosities of
L
* ≡
L
phot = 10
7, 10
6, and 10
5
L
☉, respectively. The filled points are the present-day properties of the systems from Table 1. Other parameters are set to
M
* = 20
M
☉,
v
c
= 1 km s
−1,
X
g
= 0.005,
T
d
= 1500 K,
N = 7,
for silicate dust formation as a function of stellar temperature
T
*. The results for graphitic dusts are very similar. The lower left panel labels the regions. Dust can form in the region labeled
"dust forms," above the photoionization ("ionized"), growth ("no growth"), and photoevaporation ("photoevaporated") limits.
The photoevaporation limits are for minimum photon energies of
E
0 = 7.5 (stronger) and 10 eV (weaker). The left, middle, and right columns are for the three different assumptions about the
apparent photospheric temperature. In the quiescent state (left) the photospheric temperature is the stellar temperature,
T
phot =
T
*, in the S Doradus state (middle) the photospheric temperature of
T
phot = min(
T
*, 7000 K) is assumed to be determined by an expansion of the stellar photosphere that is uncorrelated with the wind, and in
the eruptive state (right) the apparent temperature is determined by the non-dust optical depth of the wind. The dotted contour
in this column is the contour where
T
phot = 7000 K. The upper, middle, and lower panels show the changes for stellar luminosities of
L
* ≡
L
phot = 10
7, 10
6, and 10
5
L
☉, respectively. The filled points are the present-day properties of the systems from Table 1. Other parameters are set to
M
* = 20
M
☉,
v
c
= 1 km s
−1,
X
g
= 0.005,
T
d
= 1500 K,
N = 7,
 , and
m
0 = 20
m
p
.
, and
m
0 = 20
m
p
.
Other Images in This Article
Copyright and Terms & Conditions
© 2011. The American Astronomical Society. All rights reserved.