Image Details
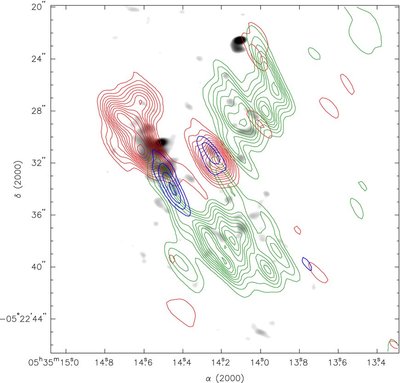
Caption: Figure 5.
Molecular emission contours from (Friedel & Snyder 2008) overlaid on the grayscale continuum (uniformly weighted map). The continuum has been logarithmically scaled to show the weaker features in this high dynamic range image. The gray (red in online edition) contours are ethyl cyanide [C 2H 5CN], dashed (green in online edition) contours are dimethyl ether [(CH 3) 2O], and the black (blue in online edition) contours are acetone [(CH 3) 2CO].
Other Images in This Article

Copyright and Terms & Conditions
© 2011. The American Astronomical Society. All rights reserved.
Copyright ©
2025 Astronomy Image Explorer. All Rights Reserved.