Image Details
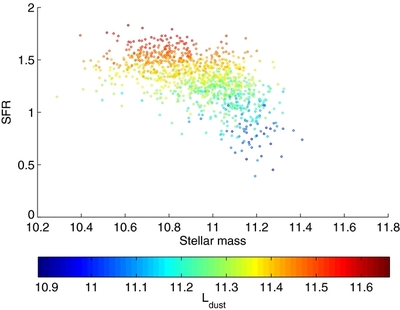
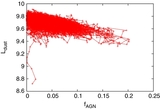
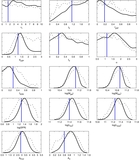
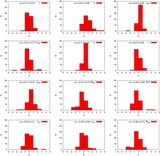
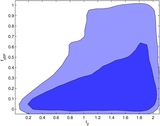
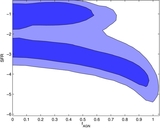
Caption: Figure 1.
Samples from the posterior distribution for a test galaxy; the high density of points in the parameter space corresponds to large values of the posterior. Units are M ☉ yr −1, M ☉, L ☉ for SFR, M star, L dust, respectively.
Other Images in This Article
Copyright and Terms & Conditions
© 2011. The American Astronomical Society. All rights reserved.
Copyright ©
2025 Astronomy Image Explorer. All Rights Reserved.