Image Details
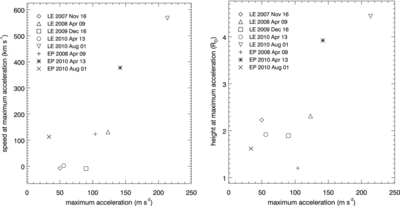
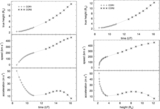
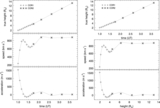
Caption: Figure 13.
Two scatter plots showing speed (left panel) and height (right panel) at the instance of maximum acceleration and the maximum acceleration itself of the six CMEs and three EPs studied. The legend shows data points corresponding to each event. Data point for the 2007 December 31 CME is not shown since it has a very high value of maximum acceleration.
Other Images in This Article
Show More
Copyright and Terms & Conditions
© 2011. The American Astronomical Society. All rights reserved.
Copyright ©
2025 Astronomy Image Explorer. All Rights Reserved.