Image Details
Caption: Figure 7.
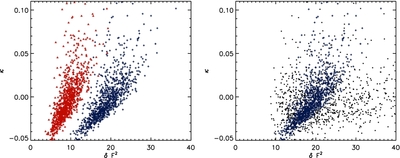
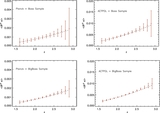
Scatter plot of κ measured along the QSO spectrum and
 for 1000 QSOs at
z = 2. In the left panel, we compare spectra with (blue crosses) and without (red triangles) redshift space distortions. In
the right panel, we compare the same spectra with redshift space distortions (blue crosses) with the same one obtained taking
into account BOSS instrumental resolution and noise (black squares).
for 1000 QSOs at
z = 2. In the left panel, we compare spectra with (blue crosses) and without (red triangles) redshift space distortions. In
the right panel, we compare the same spectra with redshift space distortions (blue crosses) with the same one obtained taking
into account BOSS instrumental resolution and noise (black squares).
Other Images in This Article


Copyright and Terms & Conditions
© 2011. The American Astronomical Society. All rights reserved.
Copyright ©
2025 Astronomy Image Explorer. All Rights Reserved.