Image Details
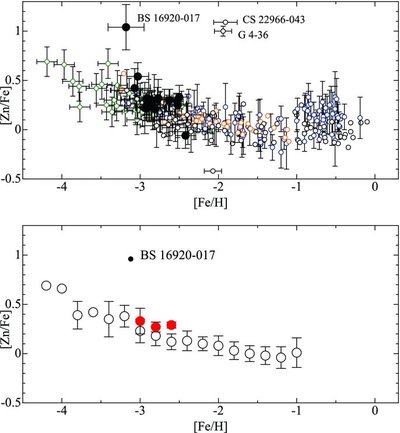
Caption: Figure 2.
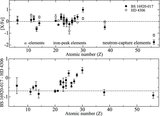
Upper panel: [Zn/Fe] abundance ratios as a function of [Fe/H] for our sample stars (filled circles). Results of previous studies are shown by open circles (Sneden et al. 1991; Johnson 2002; Mishenina et al. 2002; Ivans et al. 2003; Cayrel et al. 2004; Aoki et al. 2005; Nissen et al. 2007; Saito et al. 2009). Lower panel: the average [Zn/Fe] abundance ratios in 0.2 dex bins of [Fe/H] are shown by large filled circles for our sample and by open circles for those of previous studies. The bar indicates the standard deviation of the [Zn/Fe] values of each bin. The data of BS 16920–017 are not included in the statistics.
Other Images in This Article
Copyright and Terms & Conditions
© 2011. The American Astronomical Society. All rights reserved.