Image Details
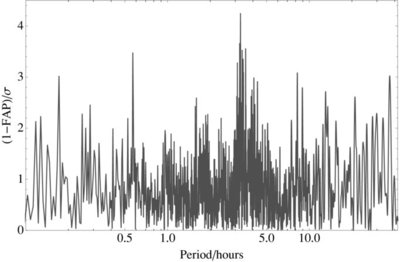
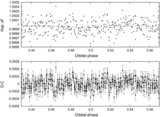
Caption: Figure 22.
F-test periodogram of residuals from primary transit light curve of Kepler-8. The y-axis gives the false-alarm-probability subtracted from unity, in sigmas confidence. The highest peak occurs for a period of 3.27 hr with amplitude 50.6 ppm.
Other Images in This Article


Show More
Copyright and Terms & Conditions
© 2011. The American Astronomical Society. All rights reserved.
Copyright ©
2025 Astronomy Image Explorer. All Rights Reserved.