Image Details
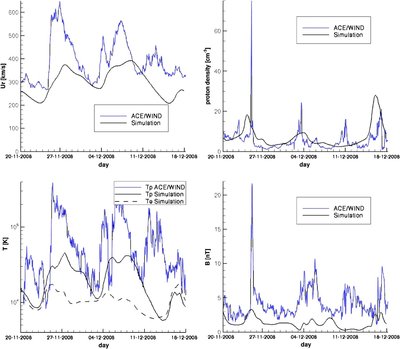
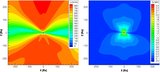
Caption: Figure 10.
Comparison of the simulated whole month results with ACE at 1 AU. The comparisons are for the radial solar wind velocity (top left), the proton number density (top right), the proton temperature (bottom left), and the magnetic field strength (bottom right). The simulated electron temperature is included in the temperature plot.
Other Images in This Article

Copyright and Terms & Conditions
© 2010. The American Astronomical Society. All rights reserved.
Copyright ©
2025 Astronomy Image Explorer. All Rights Reserved.