Image Details
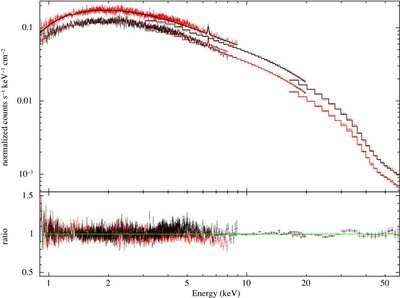
Caption: Figure 2.
Broadband spectra of 1A 0535+262 as measured by Chandra and RXTE. The spectra (0.9–60 keV) include data from MEG, HEG, PCA, and HEXTE. The top spectrum corresponds to observation 1 (red) while the bottom spectrum corresponds to observation 2 (black). The best-fit model corresponds to {pha*(cyclabs*(diskbb+bb+cutoffpl))}, see Table 1 for the best-fit parameters.
Other Images in This Article

Copyright and Terms & Conditions
© 2010. The American Astronomical Society. All rights reserved.
Copyright ©
2025 Astronomy Image Explorer. All Rights Reserved.