Image Details
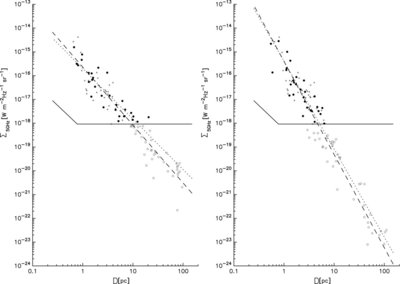
Caption: Figure 3.
Monte Carlo generated sample at 5 GHz for a scatter of 1. M82 data points (31 SNRs, signed by asterisks) are plotted together with the sensitivity (solid) line; artificially generated points are plotted above (filled circles) and below (open circles) this line. Dashed line: fit before selection; dotted line: fit after selection. Left: vertical offsets for a simulated slope of 2.4; right: orthogonal offsets for a simulated slope of 3.9.
Other Images in This Article
Copyright and Terms & Conditions
© 2010. The American Astronomical Society. All rights reserved.
Copyright ©
2025 Astronomy Image Explorer. All Rights Reserved.