Image Details
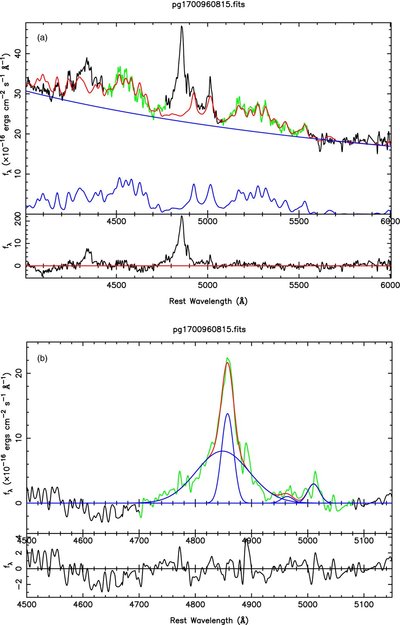
Caption: Figure 2.
Example spectral decomposition for PG 1700+518. In the top panel, the black curve is the observed spectrum after the corrections of Galactic-extinction and the redshift; the red line is the sum of the power-law continuum and Fe ii multiples (blue curves). The green ranges are our fitting windows. The bottom panel is the multi-Gaussian fits for the Hβ and [O iii] lines. The red line is the sum of all multi-Gaussian fits (blue curves). The green curve is our fitting range for the pure Hβ and [O iii] emissions after the subtraction of the power-law continuum and Fe ii multiples.
Other Images in This Article

Copyright and Terms & Conditions
© 2010. The American Astronomical Society. All rights reserved.
Copyright ©
2026 Astronomy Image Explorer. All Rights Reserved.