Image Details
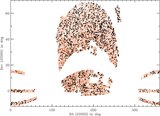
Caption: Figure 4.
Contour plot of the CCF between RASS-AGNs and LRGs for the total sample, the low L X AGN sample, the high L X AGN sample, as well as the LRG ACF (left to right). Contour lines show constant correlation strength for the 2D correlation function ξ( r P , π). The data are not smoothed. The contour levels are 0.0 (dotted line), 0.1, 0.2, 0.5, 1.0 (thick solid line), 2.0, and 5.0.
Other Images in This Article
Copyright and Terms & Conditions
© 2010. The American Astronomical Society. All rights reserved.
Copyright ©
2025 Astronomy Image Explorer. All Rights Reserved.