Image Details
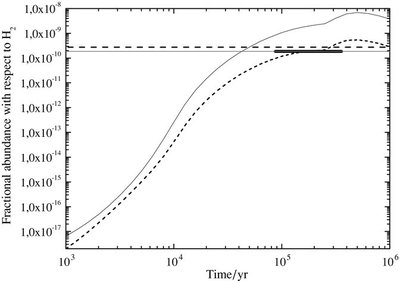
Caption: Figure 3.
Evolution of HCOOH in TMC-1 using the latest release of the UMIST Database for Astrochemistry (solid black curve). The dotted line is the result from the model including the branching fractions and thermal rate coefficient for the dissociative recombination of protonated formic acid as determined by our experiment. The gray horizontal line represents the upper limit for the abundance of HCOOH in TMC-1 as given in Ohishi et al. (1992). The bold black part of this line is located roundabout the estimated chemical age of TMC-1 (~10 5 yr). The dotted horizontal line is the abundance of HCOOH in L134N as given by Irvine et al. (1990).
Other Images in This Article
Copyright and Terms & Conditions
© 2010. The American Astronomical Society. All rights reserved.