Image Details
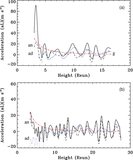
Caption: Figure 4.
(a) Speed–time profile of a CME observed on 2005 January 8 obtained using three point differences of height–time data. Dashed line is the spline interpolation fit to show the oscillation pattern. (b) Same as above for the CME on 2005 January 10.
Other Images in This Article


Copyright and Terms & Conditions
© 2010. The American Astronomical Society. All rights reserved.
Copyright ©
2025 Astronomy Image Explorer. All Rights Reserved.