Image Details
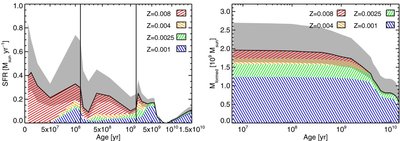
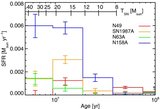
Caption: Figure 2.
Total SFH of the LMC, broken into four metallicity bins. Left panel: SFR as a function of lookback time. This plot is drawn following the style of HZ09 in three linear–linear panels that highlight the structure of the SFH at short (0–110 Myr), medium (110 Myr to 1.1 Gyr), and large (1.1 Gyr and beyond) lookback times. The gray area represents the error on the total SFR. Right panel: integrated SFR displaying the cumulative stellar mass formed in the LMC as a function of lookback time. Adapted from Figure 11 in HZ09.
Other Images in This Article
Copyright and Terms & Conditions
© 2009. The American Astronomical Society. All rights reserved.
Copyright ©
2025 Astronomy Image Explorer. All Rights Reserved.