Image Details
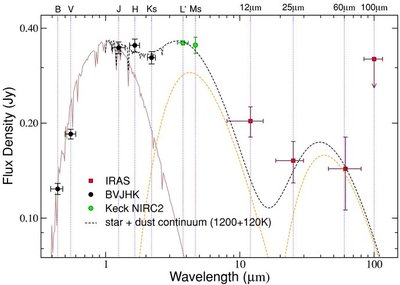
Caption: Figure 4.
We detect significant infrared excesses from TYC 4144 329 2 at wavelengths greater than ~1 μ m. The solid brown curve that peaks near 1 μ m is a synthetic stellar spectrum (Hauschildt et al. 1999) for a 7000 K effective temperature star reddened by an interstellar extinction model. The orange dashed curves that peak near 4 μ m and 40 μ m represent two dust continuum emission blackbodies fitted to dust temperatures of 1200 and 120 K, respectively. The black dashed line, the sum of the above three curves, is a reasonable fit to most of the data points. The elevated position of the 12 μ m IRAS point suggests either a silicate emission feature or some dust with temperature intermediate between 120 and 1200 K. The total luminosity of the excess, determined by integrating under the data points between 1 μ m and 100 μ m, is ~17% of the luminosity of the star. The BV data points (shortward of 1 μ m) are from the TYCHO-2 catalog, whereas the JHK s data points (longward of 1 μ m) are from the 2MASS database. The green data points at L′ and M s are our own measurements obtained on UT 2007 June 23 with the Keck NIRC2 camera. The L′ flux error bar is smaller than the point size on the plot. The four red data points from 12 to 100 μ m are from the IRAS Faint Source Catalog. The horizontal bars indicate the filter bandwidths.
Other Images in This Article
Copyright and Terms & Conditions
© 2009. The American Astronomical Society. All rights reserved.