Image Details
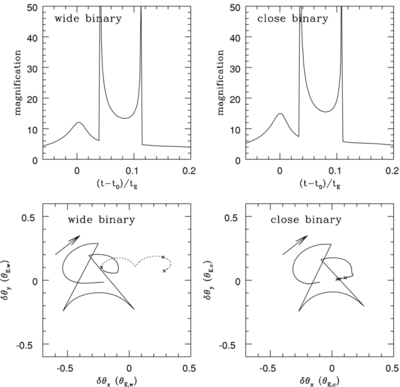
Caption: Figure 2.
Light curve and centroid shift trajectory of the source images for the binary lensing events represented in Figure 1. The arrow in the lower panel represents the direction of the centroid shift trajectory. The dotted curve in the left side of the lower panel is the centroid shift caused by the primary as shown in Figure 1. In the figure, θ E,c and θ E,w represent the Einstein ring radii corresponding to the total masses of the close and wide binaries, respectively. The crosses show the progress of the event in the interval of 30 days after the caustic-crossing.
Other Images in This Article
Copyright and Terms & Conditions
© 2009. The American Astronomical Society. All rights reserved.
Copyright ©
2025 Astronomy Image Explorer. All Rights Reserved.