Image Details
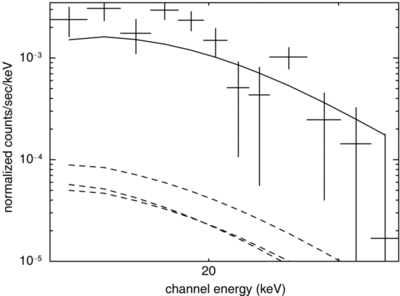
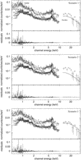
Caption: Figure 3.
Net background-subtracted 15–40 keV HXD/PIN spectrum of Mrk 273 compared with the spectral models of possible contaminants in the PIN field of view. The solid line represents the best-fit model from the XIS-HXD/PIN spectral fitting and is a sum of the flux from Mrk 273 and the contaminants. The dashed lines represent the best-fit XIS models of the contaminants extrapolated to the HXD/PIN energy range. The contributions from these contaminants to the overall PIN signals are negligible.
Other Images in This Article
Copyright and Terms & Conditions
© 2009. The American Astronomical Society. All rights reserved.
Copyright ©
2025 Astronomy Image Explorer. All Rights Reserved.