Image Details
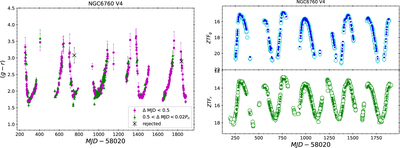
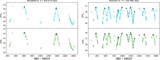
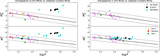
Caption: Figure 2.
Left panel: color curve for one of the Mira in our sample constructed using Equation (1). The “MJD” (modified Julian date) for the (g − r) data points are at the midpoint of the gr-band MJDs. The magenta circles and green triangles are for the pairs of gr-band data points taken in the same night (ΔMJD < 0.5 day) and taken on different nights up to 0.02P n days, respectively. Crosses are rejected data points either with errors larger than 0.35 or with anomaly C m values. Right panel: the gr-band light curves for the same Miras as in the left panel. Open and filled circles in the gr-band light curves are those without and with the color-term corrections, respectively. Note that the color-term corrections did not apply to all gr-band data points, only for those with the (g − r) counterparts. For clarity, error bars are omitted in the right panels.
Other Images in This Article
Copyright and Terms & Conditions
© 2023. The Author(s). Published by the American Astronomical Society.