Image Details
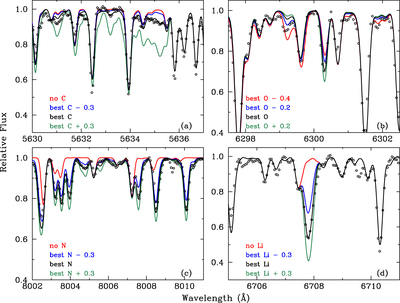
Caption: Figure 5.
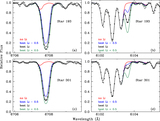
Observed and synthetic spectra for the features used to determine C, N, and O abundances in star 501, a typical program star. The observed points are shown with open circles. The meanings of the legends in each panel are the same as in Figure 4.
Other Images in This Article
Copyright and Terms & Conditions
© 2023. The Author(s). Published by the American Astronomical Society.
Copyright ©
2025 Astronomy Image Explorer. All Rights Reserved.