Image Details
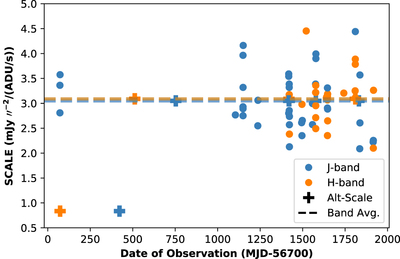
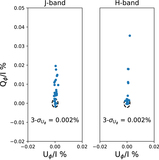
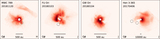
Caption: Figure 3.
This figure shows the flux calibration scale for each of the targets and epochs in the sample. Blue dots are J-band observations, and orange dots are H-band observations. Observations that have their scale factors corrected (see Section 3.1) are noted with plus signs with their corrected values. Average J- and H-band scale factors are shown as dashed lines.
Other Images in This Article
Show More
Copyright and Terms & Conditions
© 2022. The Author(s). Published by the American Astronomical Society.
Copyright ©
2025 Astronomy Image Explorer. All Rights Reserved.