Image Details
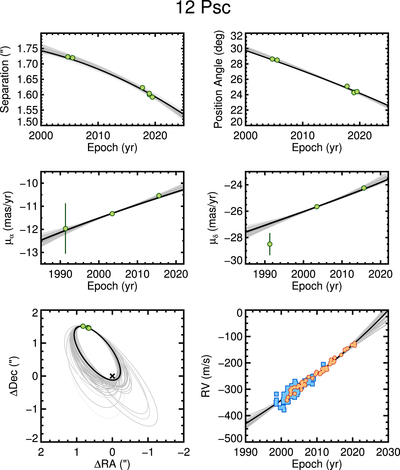
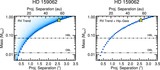
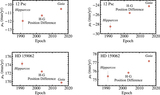
Caption: Figure 10.
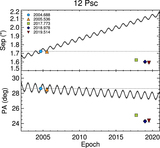
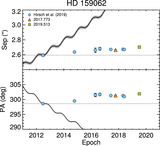
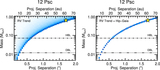
Keplerian orbit fit to the relative astrometry of 12 Psc B (top and lower left panels), the astrometric acceleration of the host star from the HGCA (middle panels), and RVs of 12 Psc (lower right panel). Fifty random orbits drawn from the MCMC chains are shown in gray and are color coded based on their χ2 values; darker gray indicates a lower χ2 value and a better fit. The best-fit orbit is shown in black. In the lower right panel, blue squares are Lick RVs and orange circles are from the Tull Spectrograph.
Other Images in This Article
Show More
Copyright and Terms & Conditions
© 2021. The American Astronomical Society. All rights reserved.
Copyright ©
2025 Astronomy Image Explorer. All Rights Reserved.