Image Details
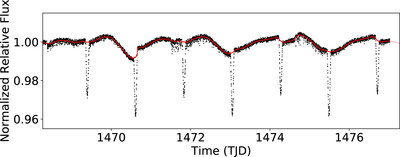
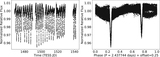
Caption: Figure 7.
The first 10 days of the TESS light curve spanning Sectors 6 to 8, shown in TESS Julian Days (TJD). The black points are the TESS data and the red line is the Biweighted Midcorrelation filter applied to the flux baseline. We used a window size of 6 hr which equals 3 times the transit duration reported by BLS.
Other Images in This Article

Show More
Copyright and Terms & Conditions
© 2020. The American Astronomical Society. All rights reserved.
Copyright ©
2025 Astronomy Image Explorer. All Rights Reserved.