Image Details
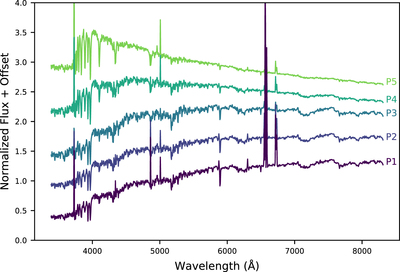
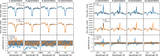
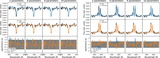
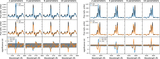
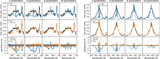
Caption: Figure 12.
Synthetic spectra along the post-starburst sequence in Figure 8, plotted with offsets added to separate the spectra. The sequence starts with an old stellar population with nebular lines and ends with post-starburst spectrum with a young stellar population but weak nebular emission lines.
Other Images in This Article
Show More
Copyright and Terms & Conditions
© 2020. The American Astronomical Society. All rights reserved.
Copyright ©
2026 Astronomy Image Explorer. All Rights Reserved.