Image Details
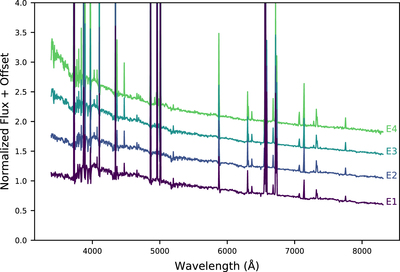
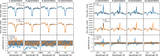
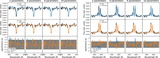
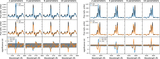
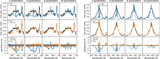
Caption: Figure 11.
Synthetic spectra along the starburst sequence in Figure 8, plotted with offsets added to separate the spectra. Proceeding through the sequence, the nebular emission lines strengthen and the blue end of the continuum rises.
Other Images in This Article
Show More
Copyright and Terms & Conditions
© 2020. The American Astronomical Society. All rights reserved.
Copyright ©
2026 Astronomy Image Explorer. All Rights Reserved.