Image Details
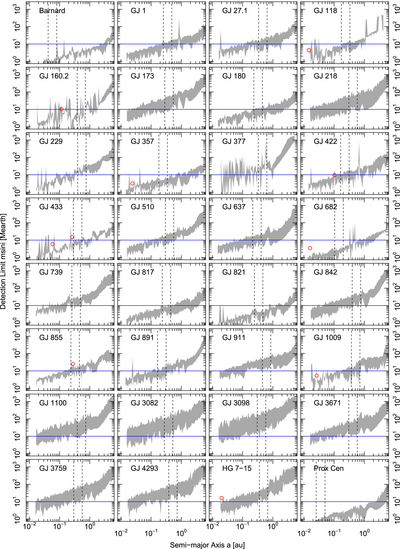
Caption: Figure 4.
Probabilistic detection limits for the new UVES data of 34 M dwarfs. The N statistically significant signals found in a given data set are denoted by the red circles. The gray region in each panel shows the probabilistic detection limit, which is defined by the 50% quantile of the posterior distribution of semi-amplitude (K50%) and the maximum of semi-amplitude Kmax in the posterior samples for the N + 1 signal. The habitable zone denoted by dashed lines is calculated using the method introduced by Kopparapu et al. (2014). The blue horizontal line represents the 10 M⊕ limit.
Other Images in This Article

Copyright and Terms & Conditions
© 2019. The American Astronomical Society. All rights reserved.
Copyright ©
2026 Astronomy Image Explorer. All Rights Reserved.