Image Details
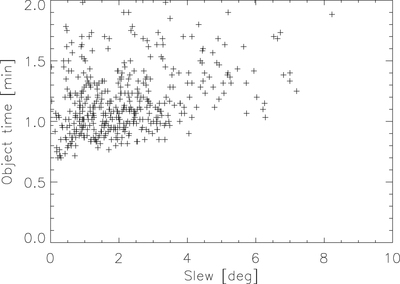
Caption: Figure 1.
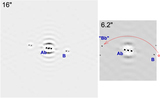
Correlation between observing time per object and the slew distance for the night of 2018 April 3/4. The vertical axis plots time between observations of successive objects.
Other Images in This Article
Copyright and Terms & Conditions
© 2019. The American Astronomical Society. All rights reserved.
Copyright ©
2025 Astronomy Image Explorer. All Rights Reserved.