Image Details
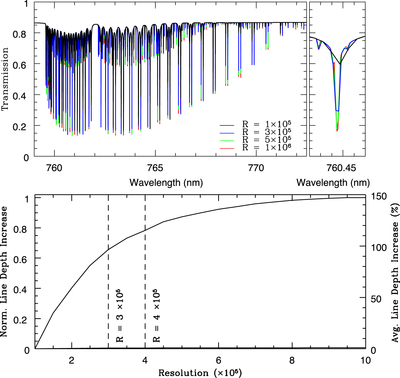
Caption: Figure 1.
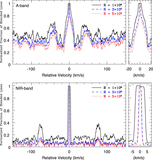
Top: 0.76 μm O2 band at four different resolutions: R = 100,000 (black), 300,000 (blue), 500,000 (green), and 1000,000 (red). The top right panel shows a zoom-in of one of the lines in the band. Bottom: increase in integrated depth of the O2 lines as a function of resolution, with respect to R = 100,000 and normalized to the integrated depth at resolution R = 1000,000.
Other Images in This Article
Copyright and Terms & Conditions
© 2019. The American Astronomical Society. All rights reserved.
Copyright ©
2026 Astronomy Image Explorer. All Rights Reserved.