Image Details
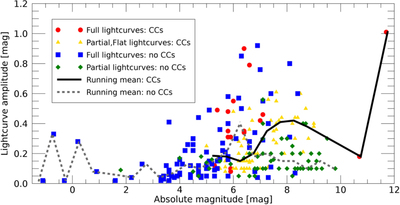
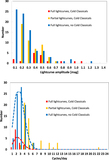
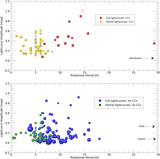
Caption: Figure 8.
We used our results and the literature to plot the light-curve amplitude versus absolute magnitude distributions of the CC population and of the other TNOs. Different symbols and colors are used to separate the two populations and the partial/full light-curve sample. Two running means using the partial and the full light curves are overplotted, one for the CC population and one for the other TNOs. The other TNOs have a roughly flat distribution across the different size regimes, whereas the CC population is showing an increase of amplitude at small sizes. Some bins only have one or zero object.
Other Images in This Article
Copyright and Terms & Conditions
© 2019. The American Astronomical Society. All rights reserved.
Copyright ©
2024 Astronomy Image Explorer. All Rights Reserved.