Image Details
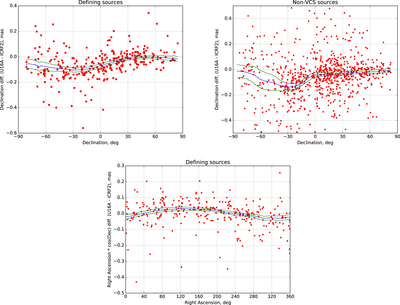
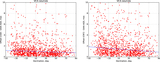
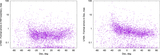
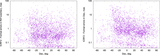
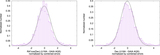
Caption: Figure 2.
Position differences in mas, in the sense U16A–ICRF2. The blue curve is a robust local estimate of the mean, while the green curves indicate its 95% confidence interval. See Appendix A for details.
Other Images in This Article
Copyright and Terms & Conditions
© 2018. The American Astronomical Society. All rights reserved.
Copyright ©
2025 Astronomy Image Explorer. All Rights Reserved.