

Image Details
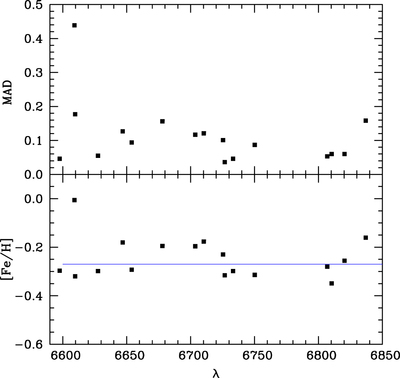
Caption: Figure 3.
For each of the 17 Fe lines the abundance [Fe/H] is shown as well as the MAD (median absolute deviation) for our spectroscopic sample. The blue horizontal line shows the cluster sample median value of [Fe/H] = n − 0.27.
Other Images in This Article
Copyright and Terms & Conditions
© 2018. The American Astronomical Society. All rights reserved.

Copyright ©
2026 Astronomy Image Explorer. All Rights Reserved.
