Image Details
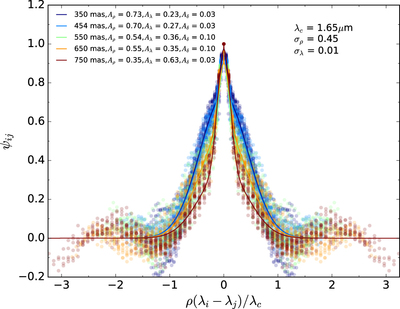
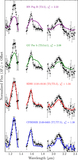
Caption: Figure 18.
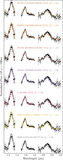
Example of the correlation function at the various angular separations included in the fit for the H-band spectral cube. The different colors correspond to the angular separations, with the circles being the value of the correlation for all of the wavelength pairs, and the lines of the same color indicate the best fit to the distribution calculated using Equation (4).
Other Images in This Article
Show More
Copyright and Terms & Conditions
© 2017. The American Astronomical Society. All rights reserved.
Copyright ©
2026 Astronomy Image Explorer. All Rights Reserved.