Image Details
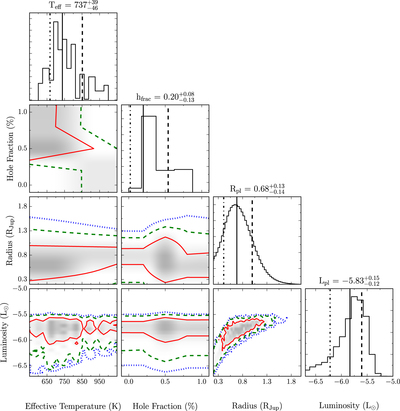
Caption: Figure 11.
Normalized posterior distributions for the iron and silicate model grid. The PDFs are for the parameters varied in our fit along with the inferred distribution of the luminosity of 51 Eri b. The lines on the 1D histogram indicate the 16th, 50th, and 84th percentile values, while those on the 2D histogram are the 1σ (solid red), 2σ (dashed green), and 3σ (dotted blue) values of the distribution. The values printed above each histogram are the median value along with the 1σ error on it.
Other Images in This Article
Show More
Copyright and Terms & Conditions
© 2017. The American Astronomical Society. All rights reserved.
Copyright ©
2026 Astronomy Image Explorer. All Rights Reserved.