Image Details
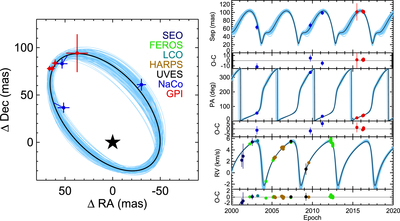
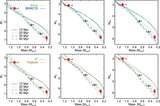
Caption: Figure 3.
The best-fitting orbit (black) and 100 randomly selected orbits (blue) from the posterior distribution. The visual orbit is shown on the left, with solid lines connecting each data point to the location on the best-fitting orbit corresponding to the observing epoch. On the right are separation, position angle, and RV against time, with observed–calculated (O–C) residuals given below each plot, with respect to the best-fitting orbit. The combination of astrometry and RVs together provide a well-constrained orbit.
Other Images in This Article
Copyright and Terms & Conditions
© 2016. The American Astronomical Society. All rights reserved.
Copyright ©
2026 Astronomy Image Explorer. All Rights Reserved.