Image Details
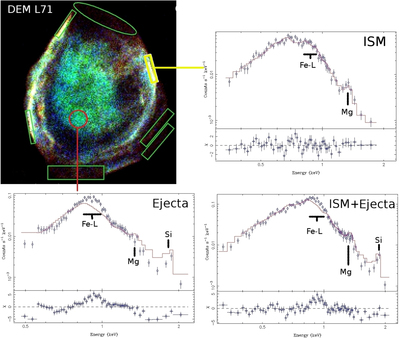
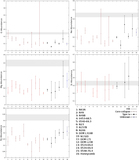
Caption: Figure 4.
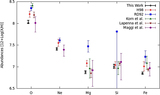
Spectral model fits for three representative regions in DEM L71. In all fits, metal abundances are fixed at our measured LMC abundance values (Table 2). ISM-only (yellow region), metal-rich ejecta only (red region), and their combined spectra. The residuals from the spectral model fits are shown at the bottom panel of each spectral plot. Green regions are the other regions used in our ISM abundance measurements.
Other Images in This Article

Copyright and Terms & Conditions
© 2016. The American Astronomical Society. All rights reserved.
Copyright ©
2024 Astronomy Image Explorer. All Rights Reserved.