Image Details
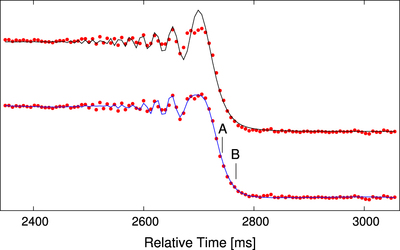
Caption: Figure 2.
The occultation data (dots) for 31 Ari, repeated twice and offset for clarity. The top set shows the best fit by a point-source model, and the bottom set the best fit by a binary model with 3.76 mas separation. The two segments mark the times of the geometrical occultation of each component. The vertical axis is in arbitrary units.
Other Images in This Article
Copyright and Terms & Conditions
© 2016. The American Astronomical Society. All rights reserved.
Copyright ©
2025 Astronomy Image Explorer. All Rights Reserved.